Visualizing the National Energy Grid
EGIVAC, System for Electric Grid Interactive Visualization, Animation, and Control, is one of the ground-breaking, feature-rich, large-scale visualizations of the US national energy grid.
Overview
In 2006-07, developed the first grid visualization system from the ground up, scaling to the full national grid sizes, 100KV to 700KV+.
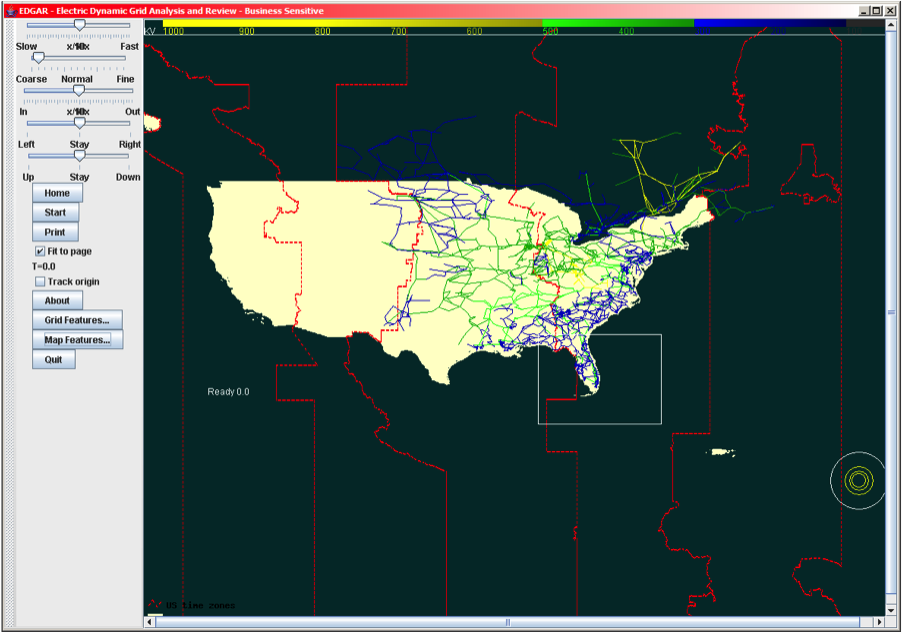
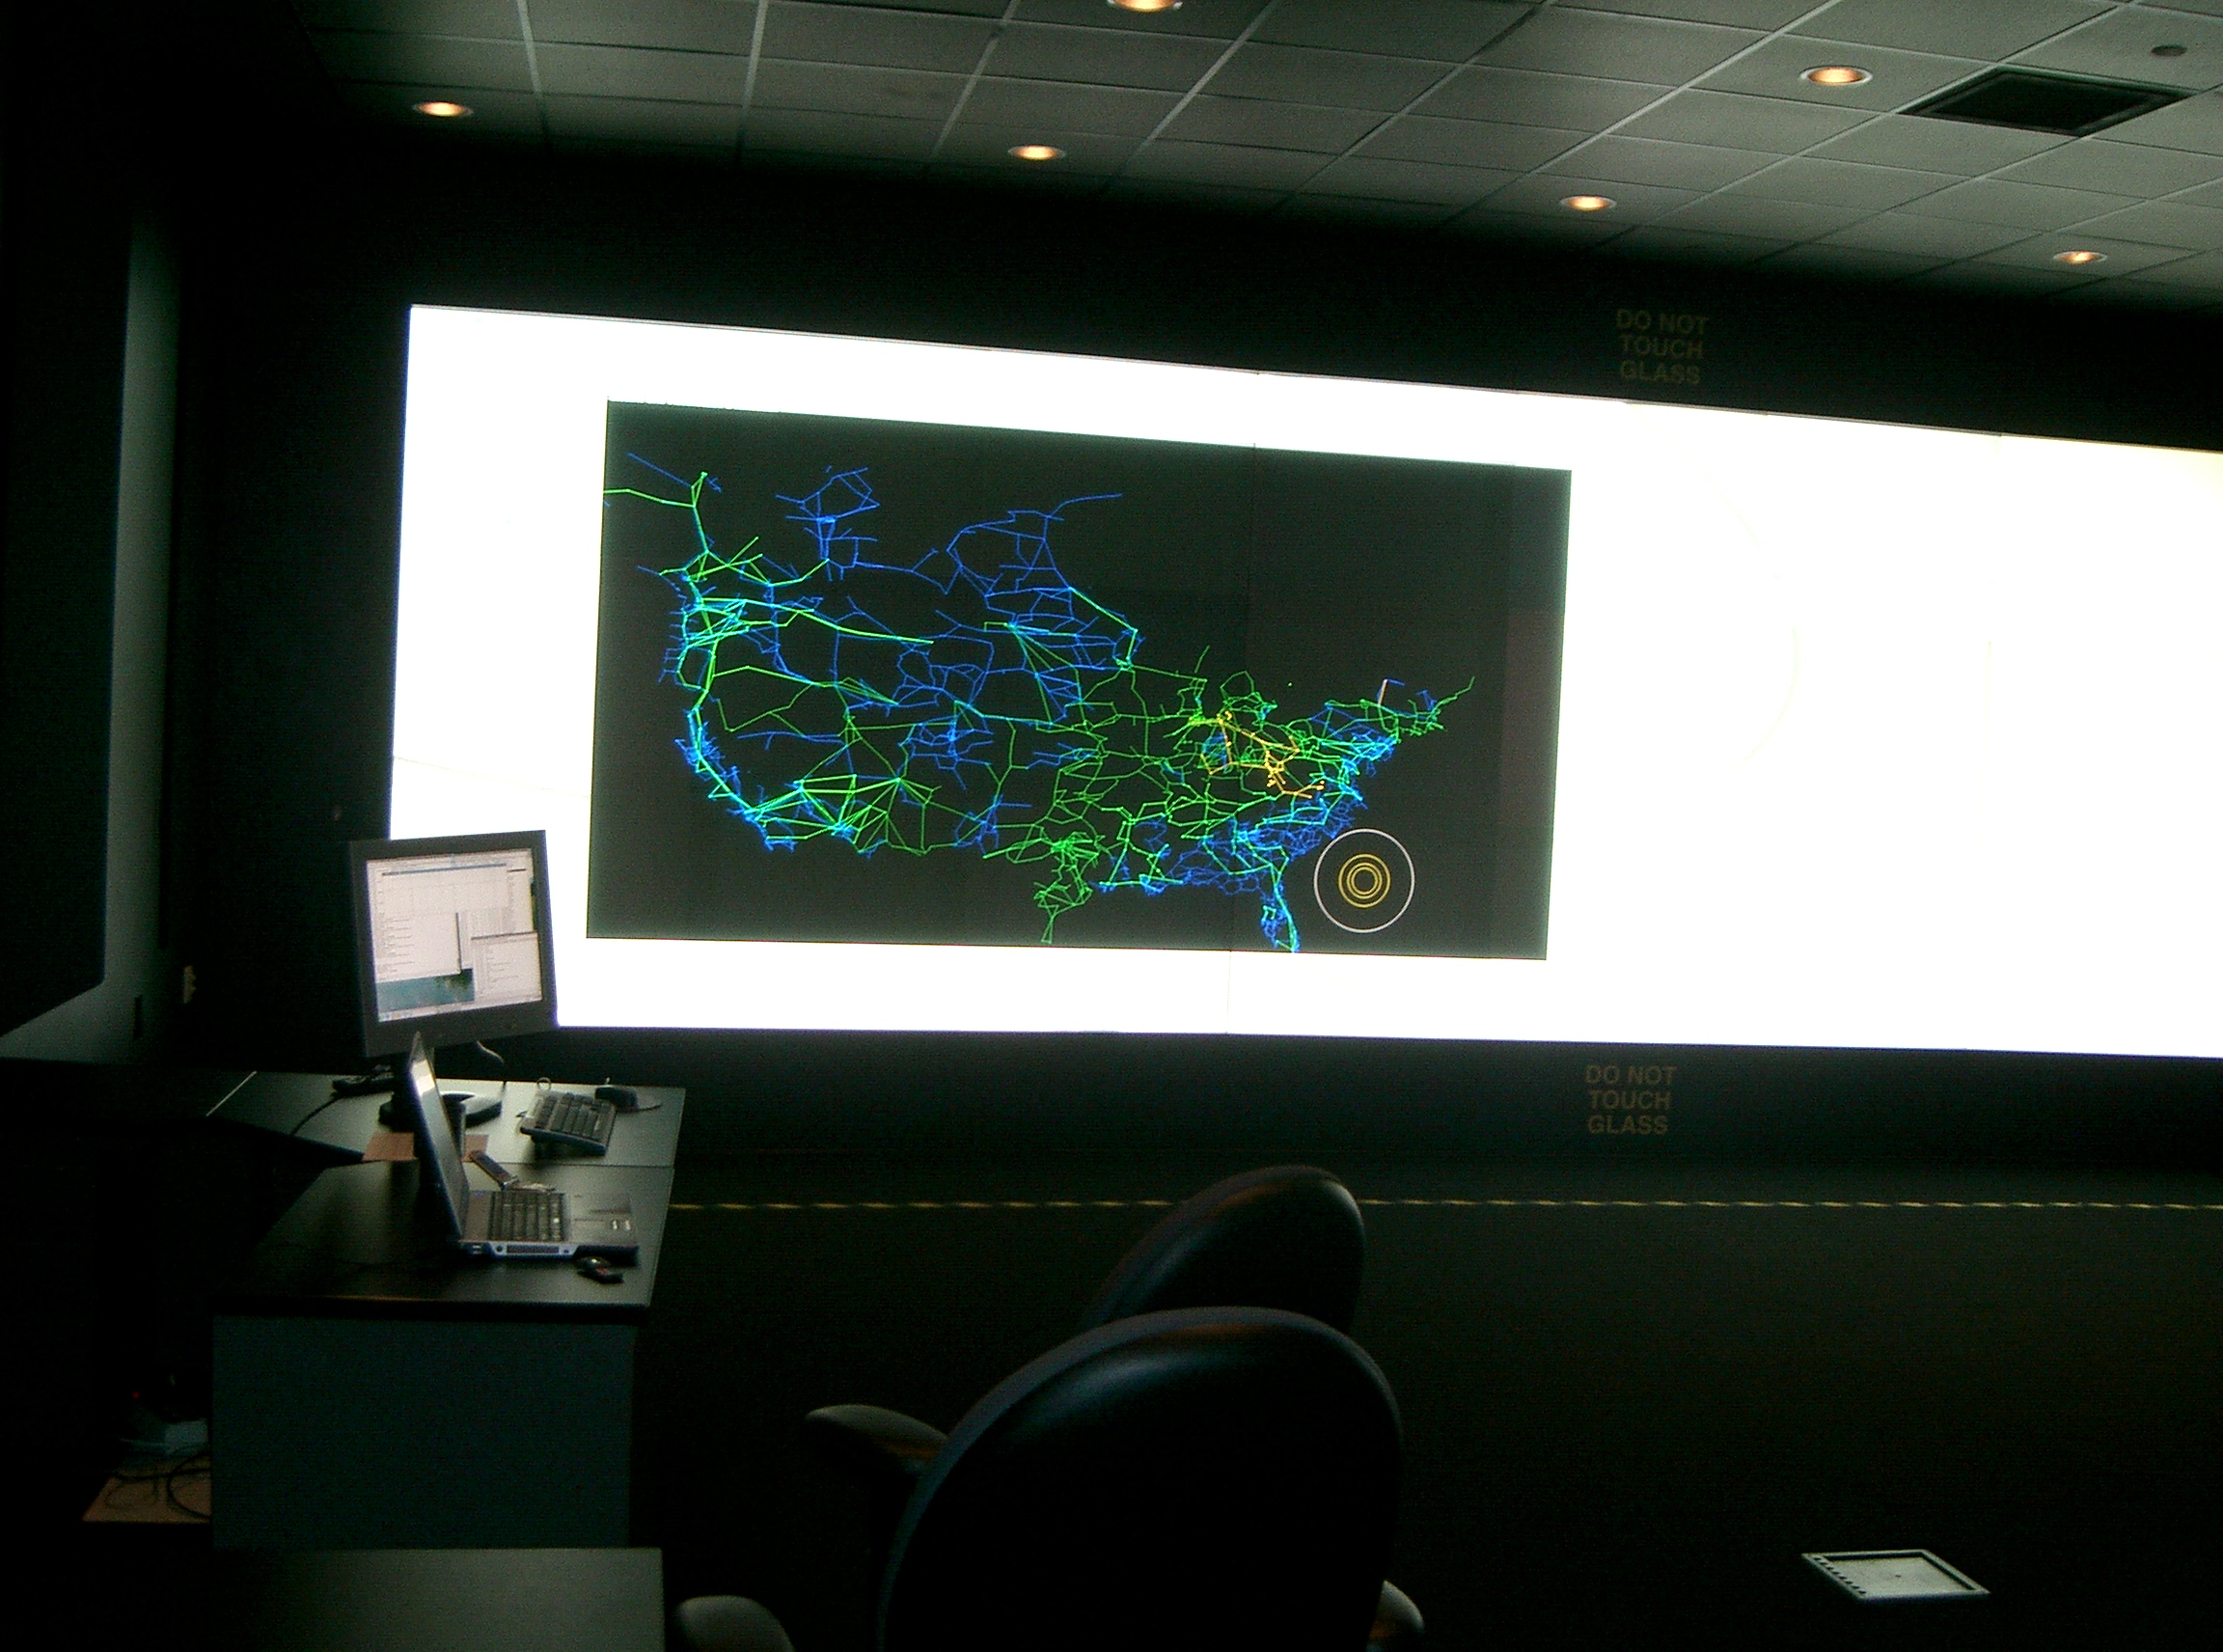
The system opened up, for the first time ever, the ability to dynamically customize geophysical layers and icons together with grid network buses and lines, shown with accurate latitude and longitude coordinates synchronized with rich geographical layers.
Gallery
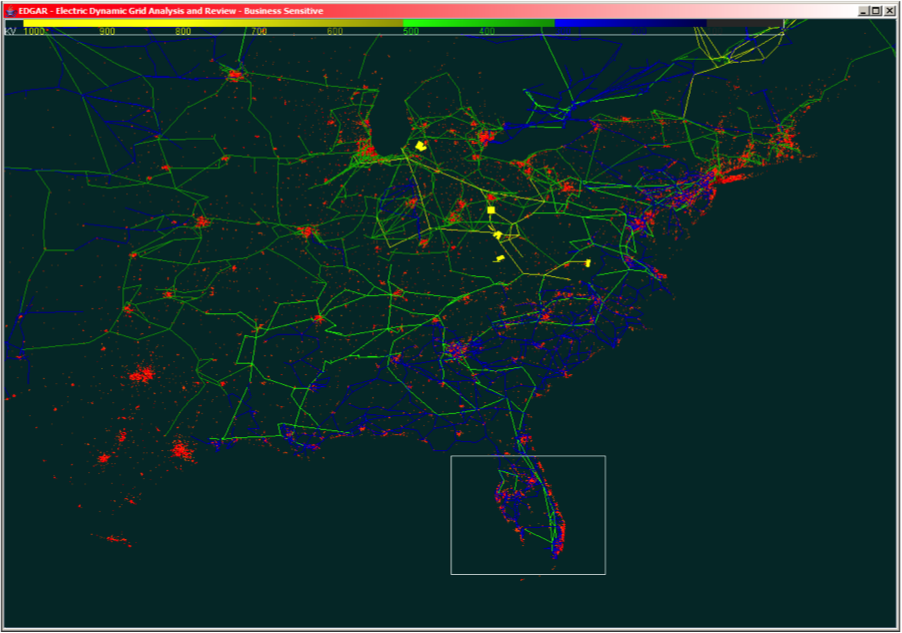
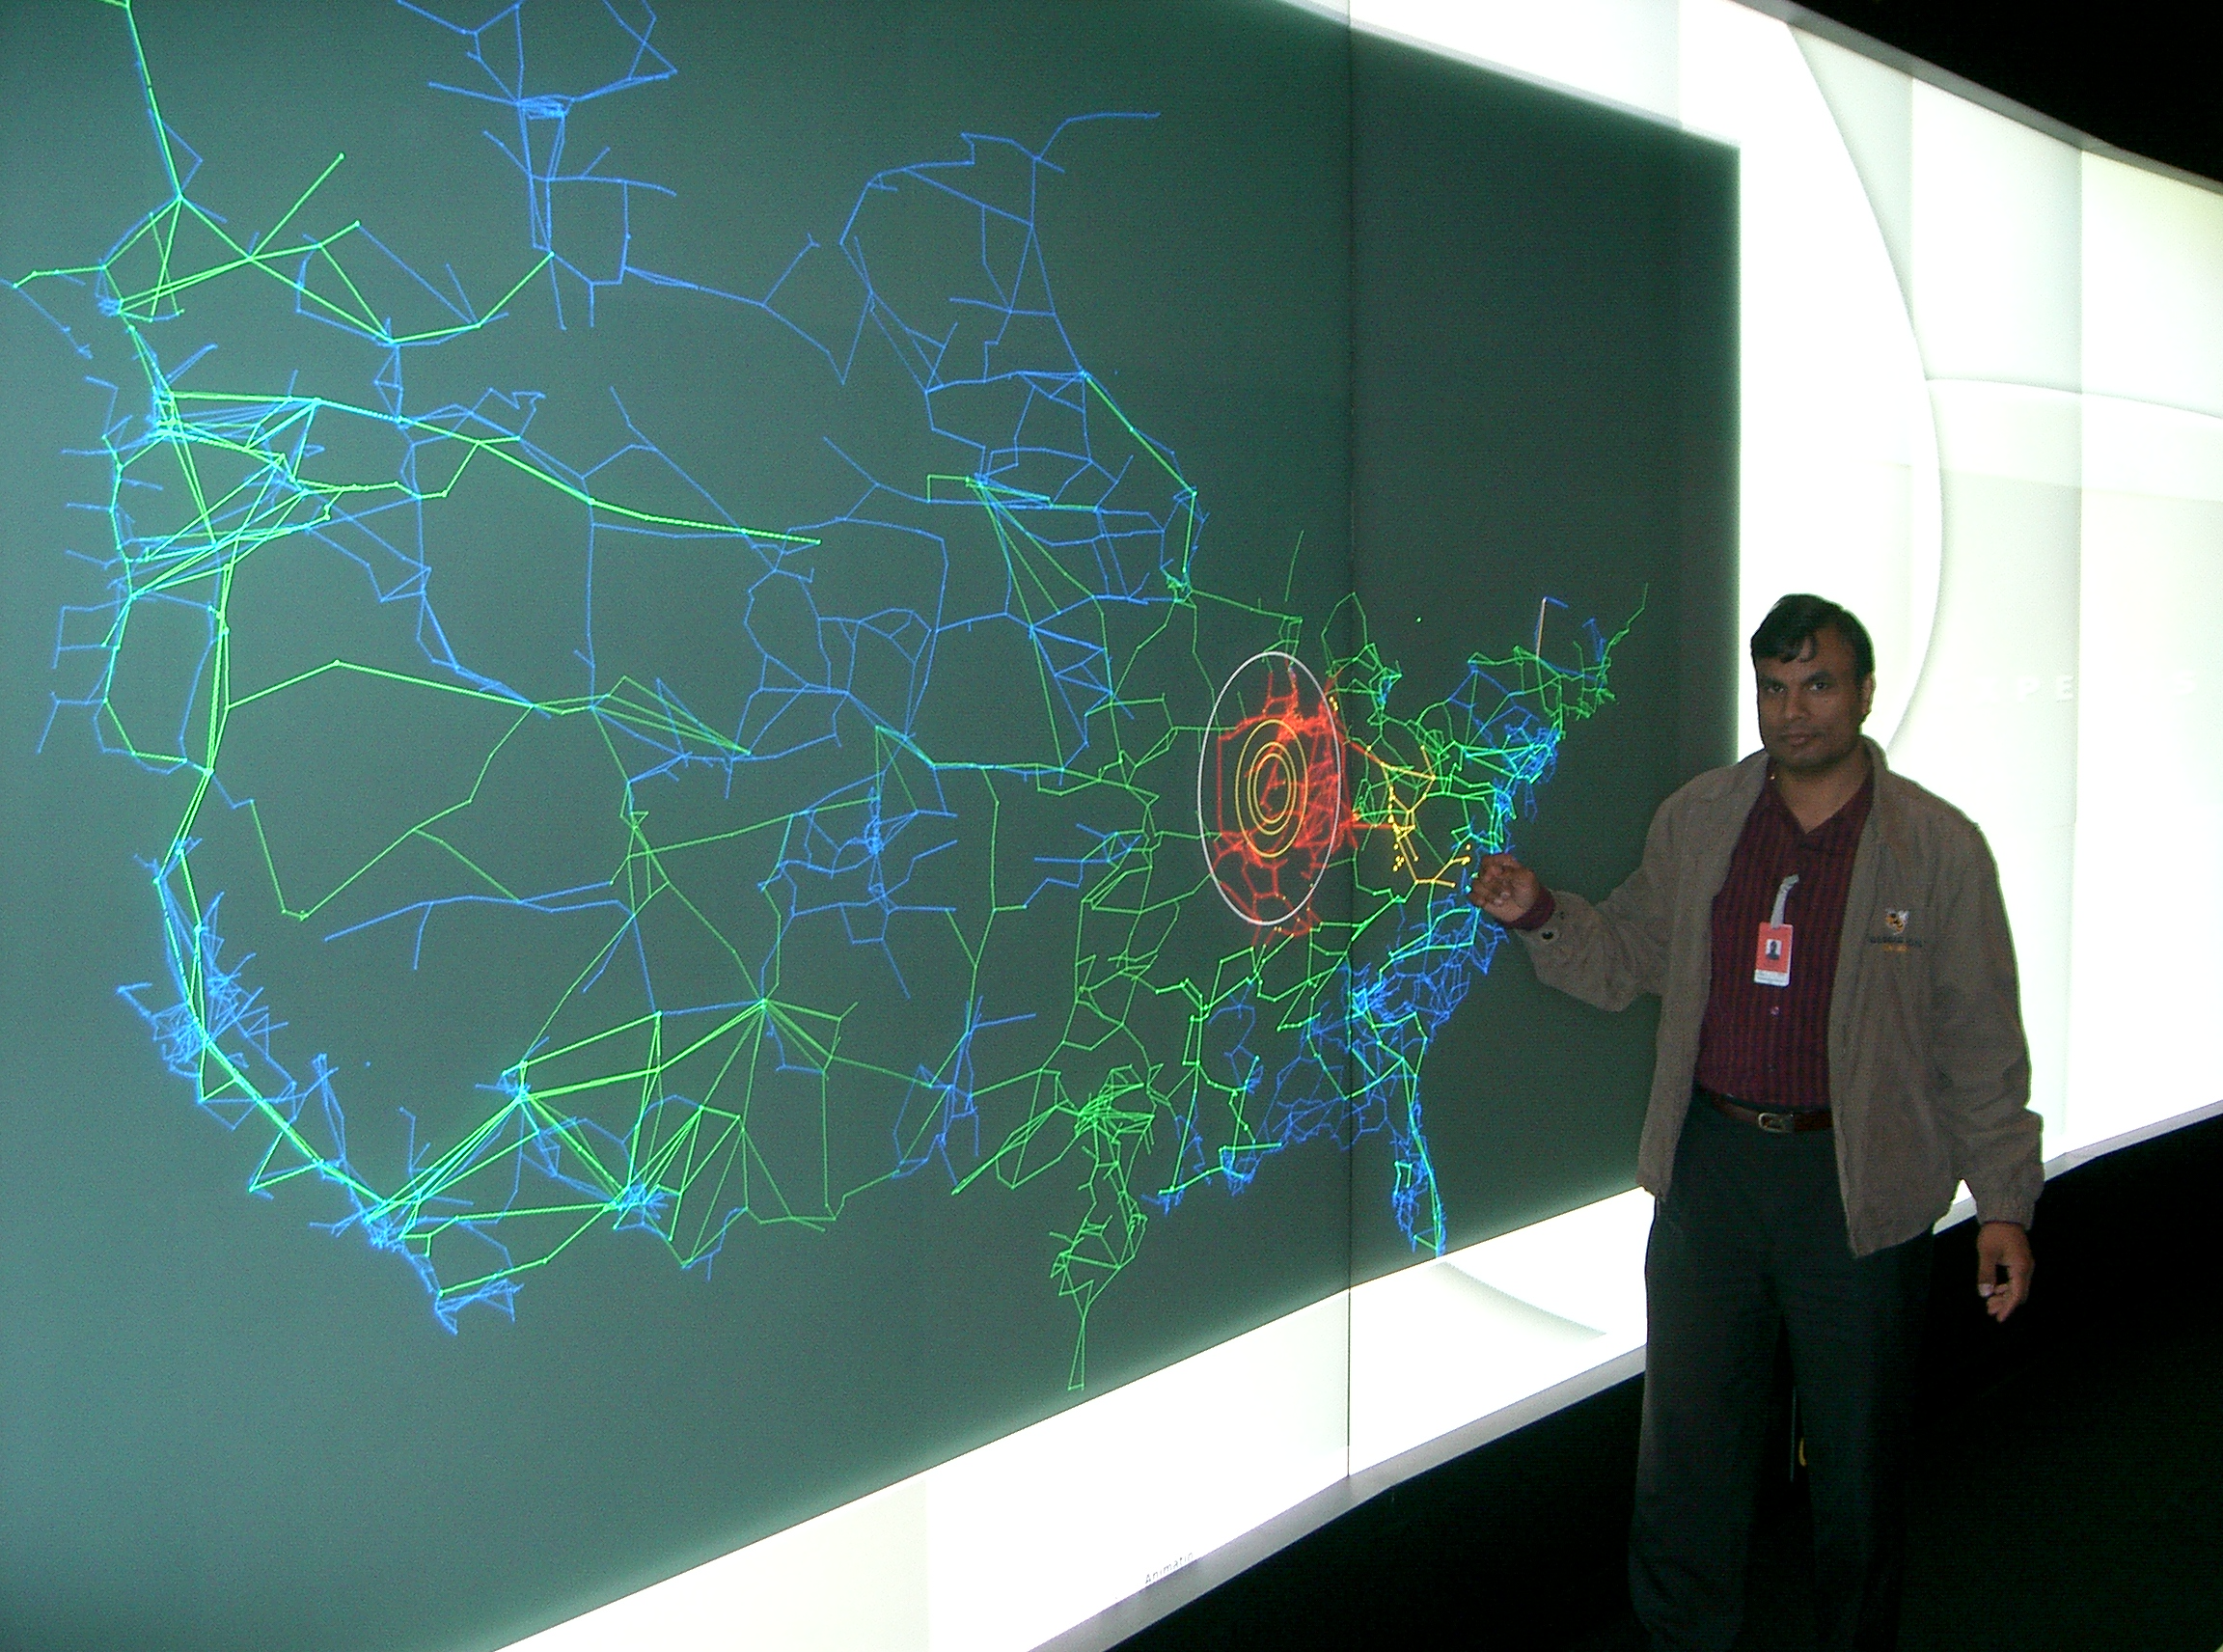
Interactive, visual differentiation based on voltage ratings was achieved for the first time at the national scale incorporating large interconnects including ERCOT and Eastern Interconnect.
The capability for the rendering to scale even from smaller personal desktop displays up to the largest, wall-sized multi-monitor systems was achieved for the first time for national energy grids.
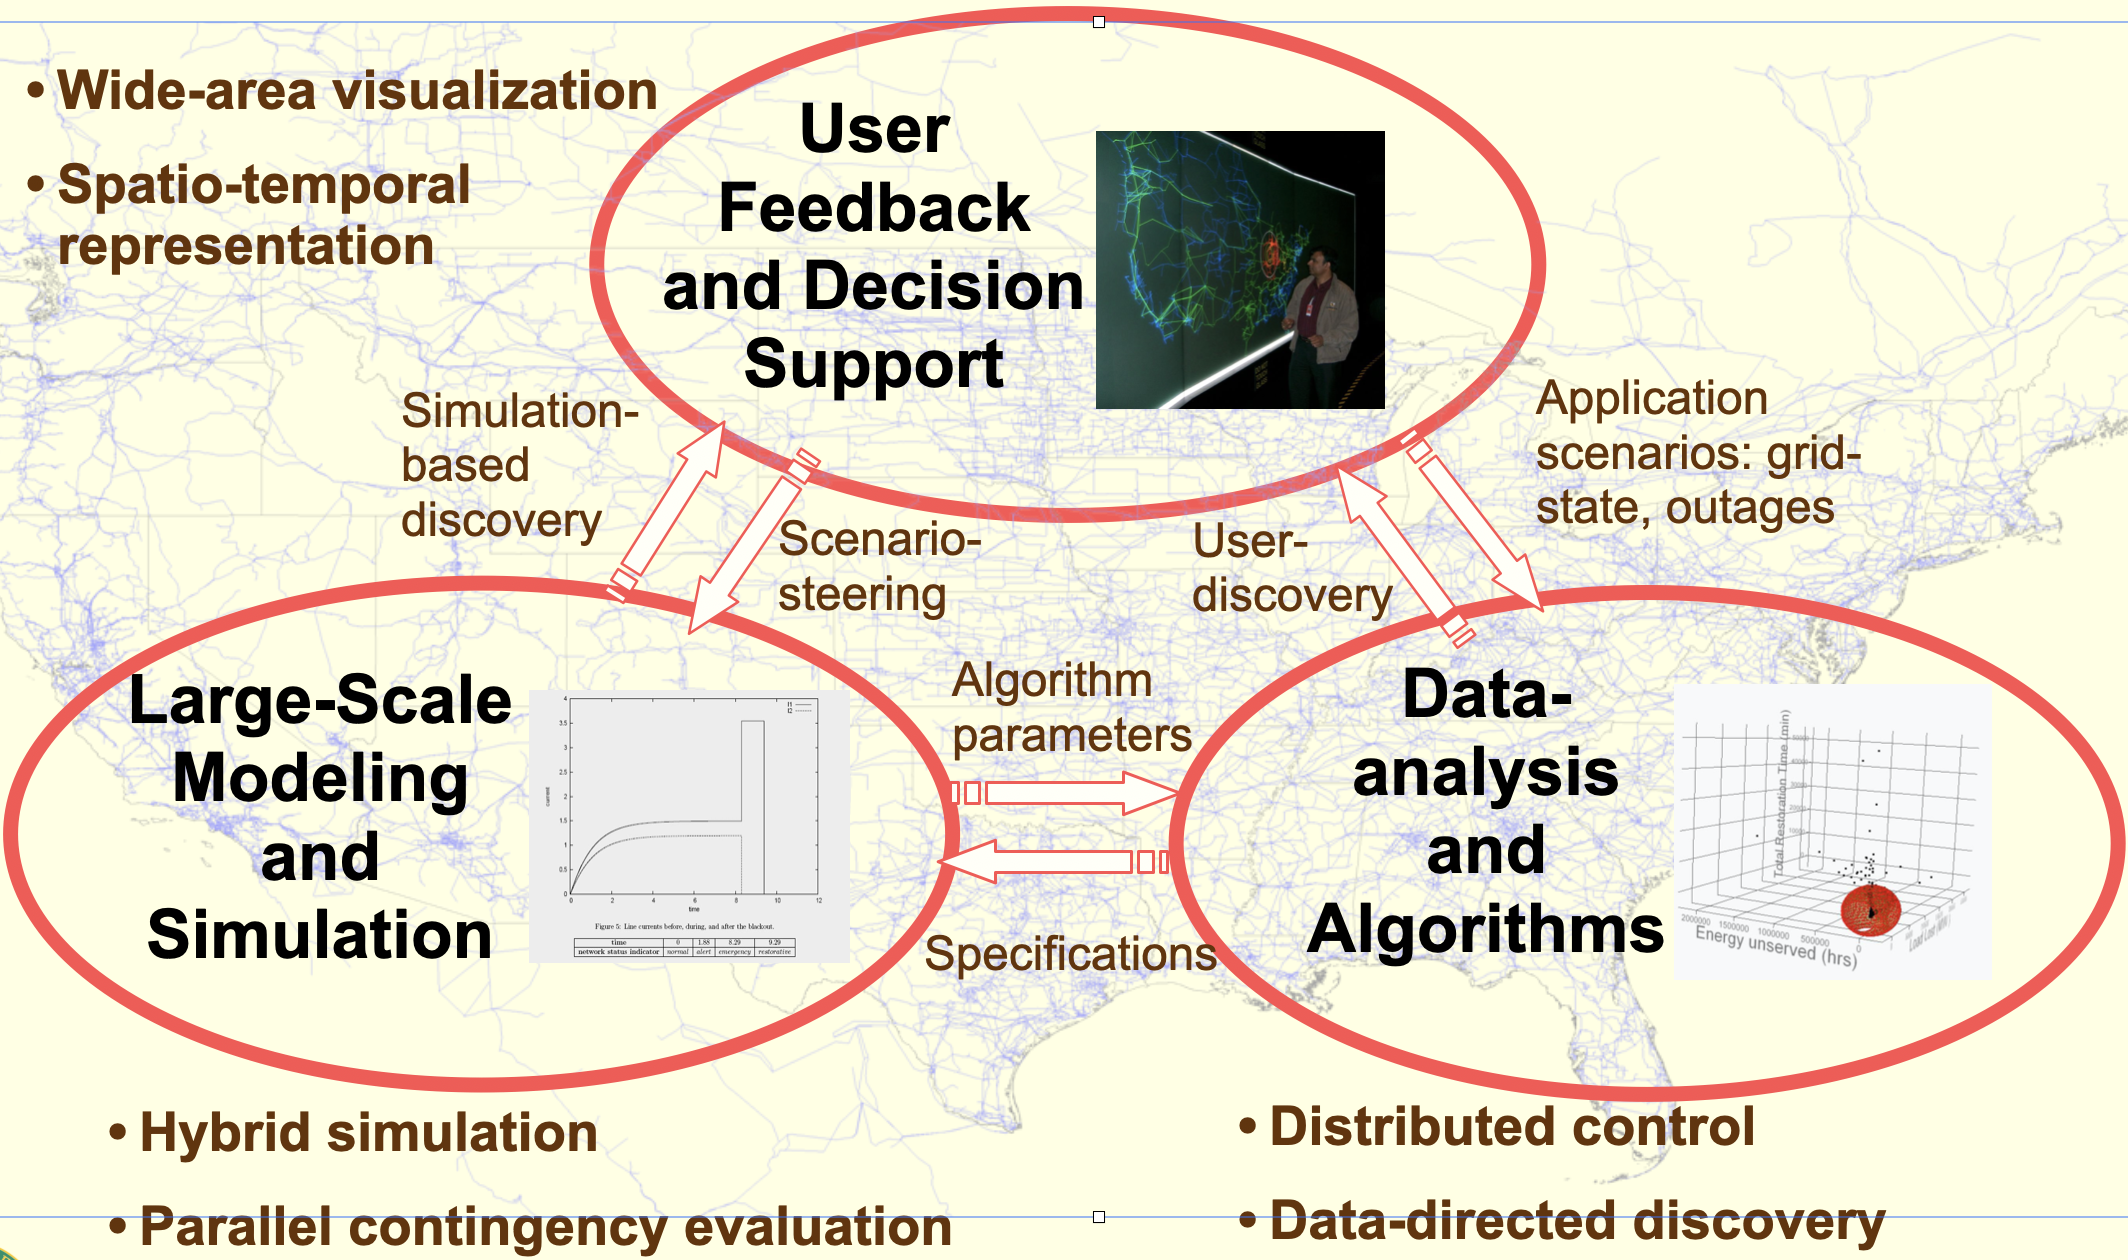
Dynamic, interactive animation capabilities provided a natural, visual evaluation of contingencies to decisionmaking teams, with the potential to tie real-time weather data streams with grid state.
Impact
This visualization system went onto inspire large investments by the US Department of Energy and other agencies in grid monitoring centers and the development of next generation systems such as VERDE and EAGLE-I.
My work also featured prominently in the research highlights of the Computational Sciences and Engineering Division across multiple years, and won the laboratory director’s award among all the lab-directed research and development projects in 2007.
Organization
- Sponsor: US Department of Energy (DOE)
- Office: Office of Electricity (OE)
- Prime: Oak Ridge National Laboratory (ORNL)
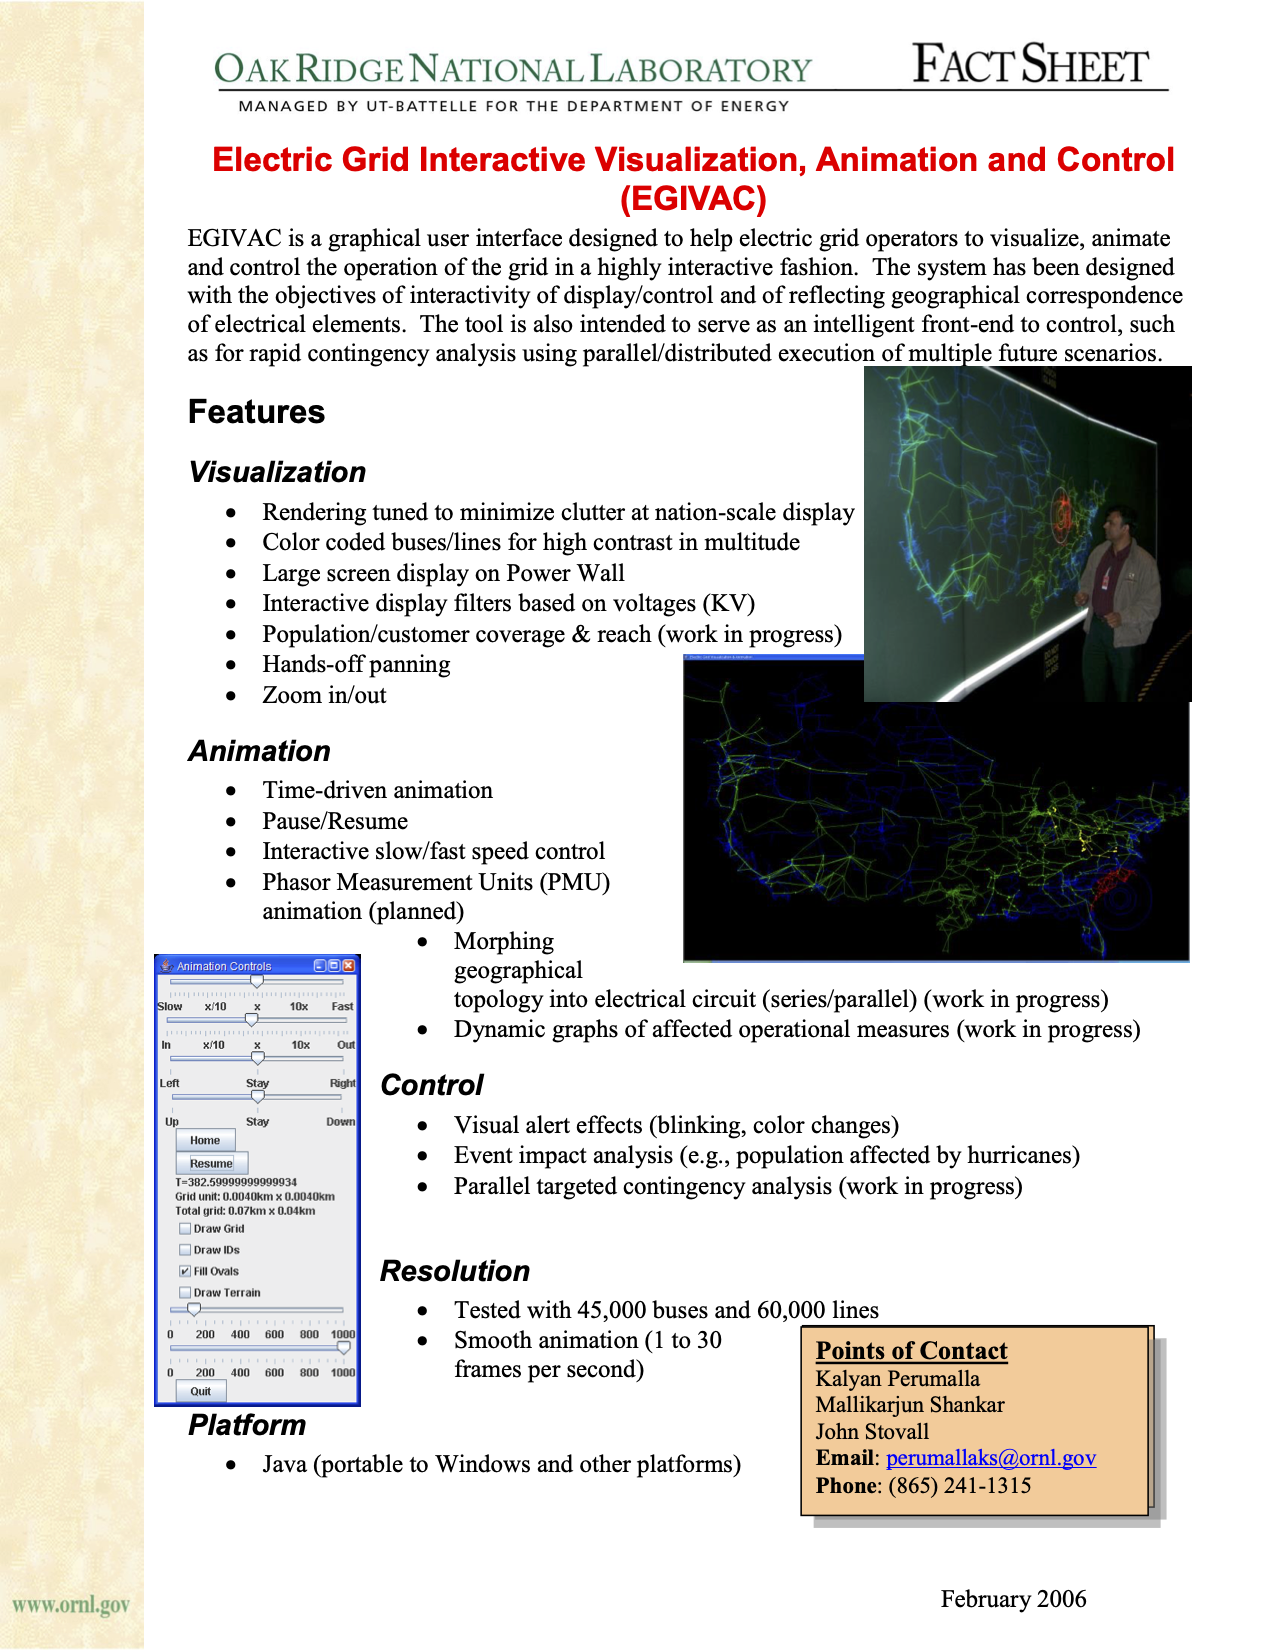
Features
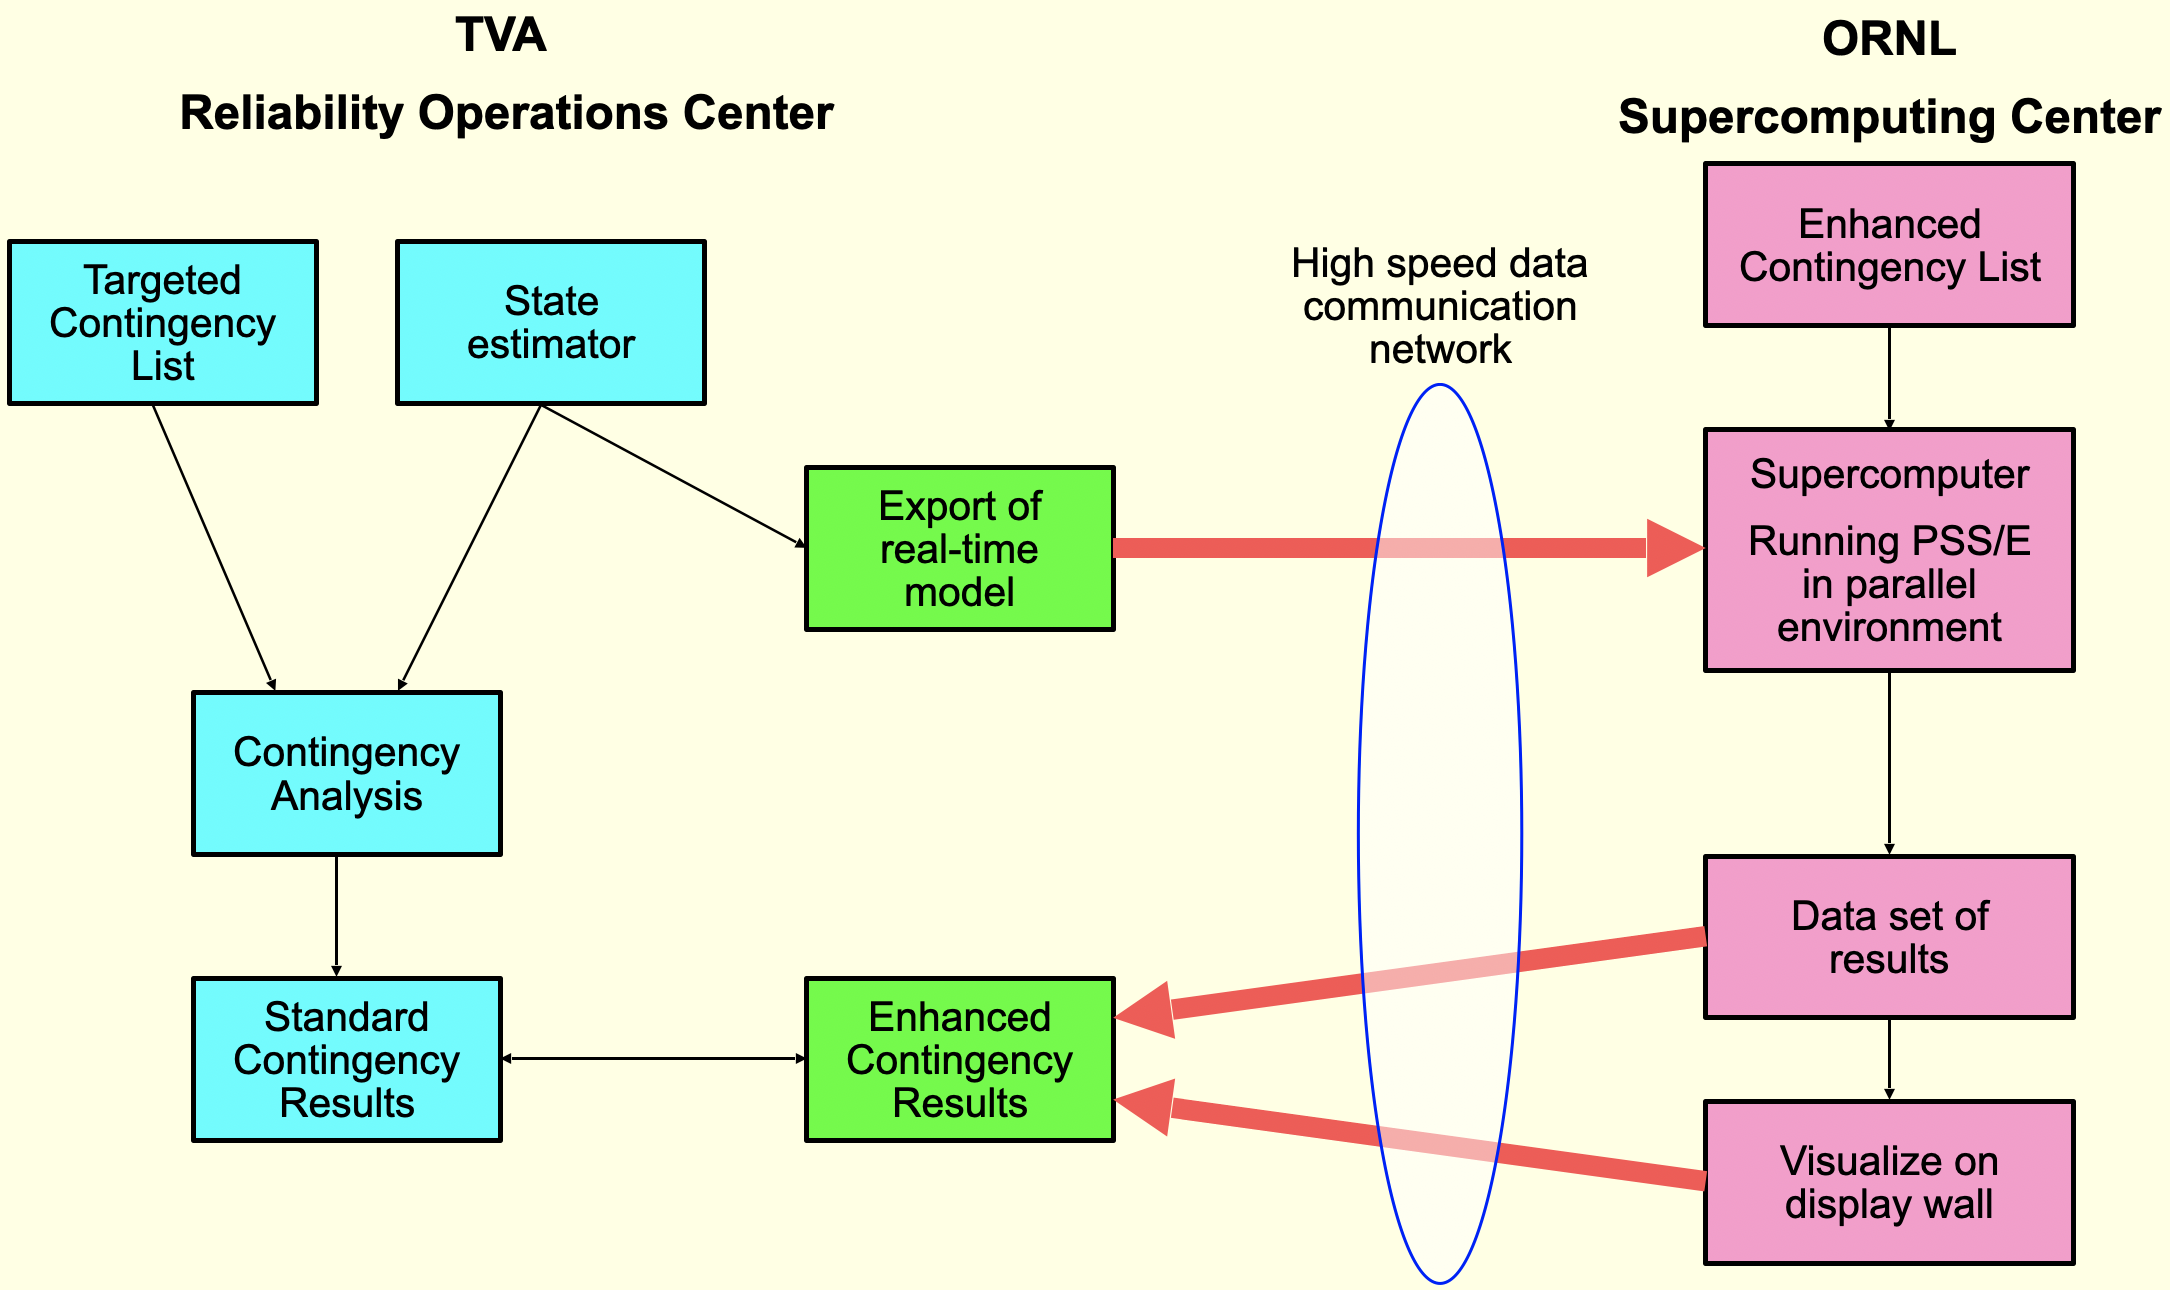
EGIVAC is a graphical user interface designed to help electric grid operators to visualize, animate and control the operation of the grid in a highly interactive fashion. The system has been designed with the objectives of interactivity of display/control and of reflecting geographical correspondence of electrical elements. The tool is also intended to serve as an intelligent front-end to control, such as for rapid contingency analysis using parallel/distributed execution of multiple future scenarios.
Visualization
- Rendering tuned to minimize clutter at nation-scale display
- Color coded buses/lines for high contrast in multitude
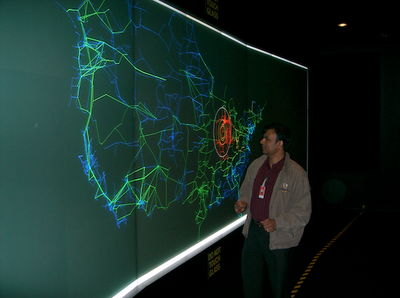
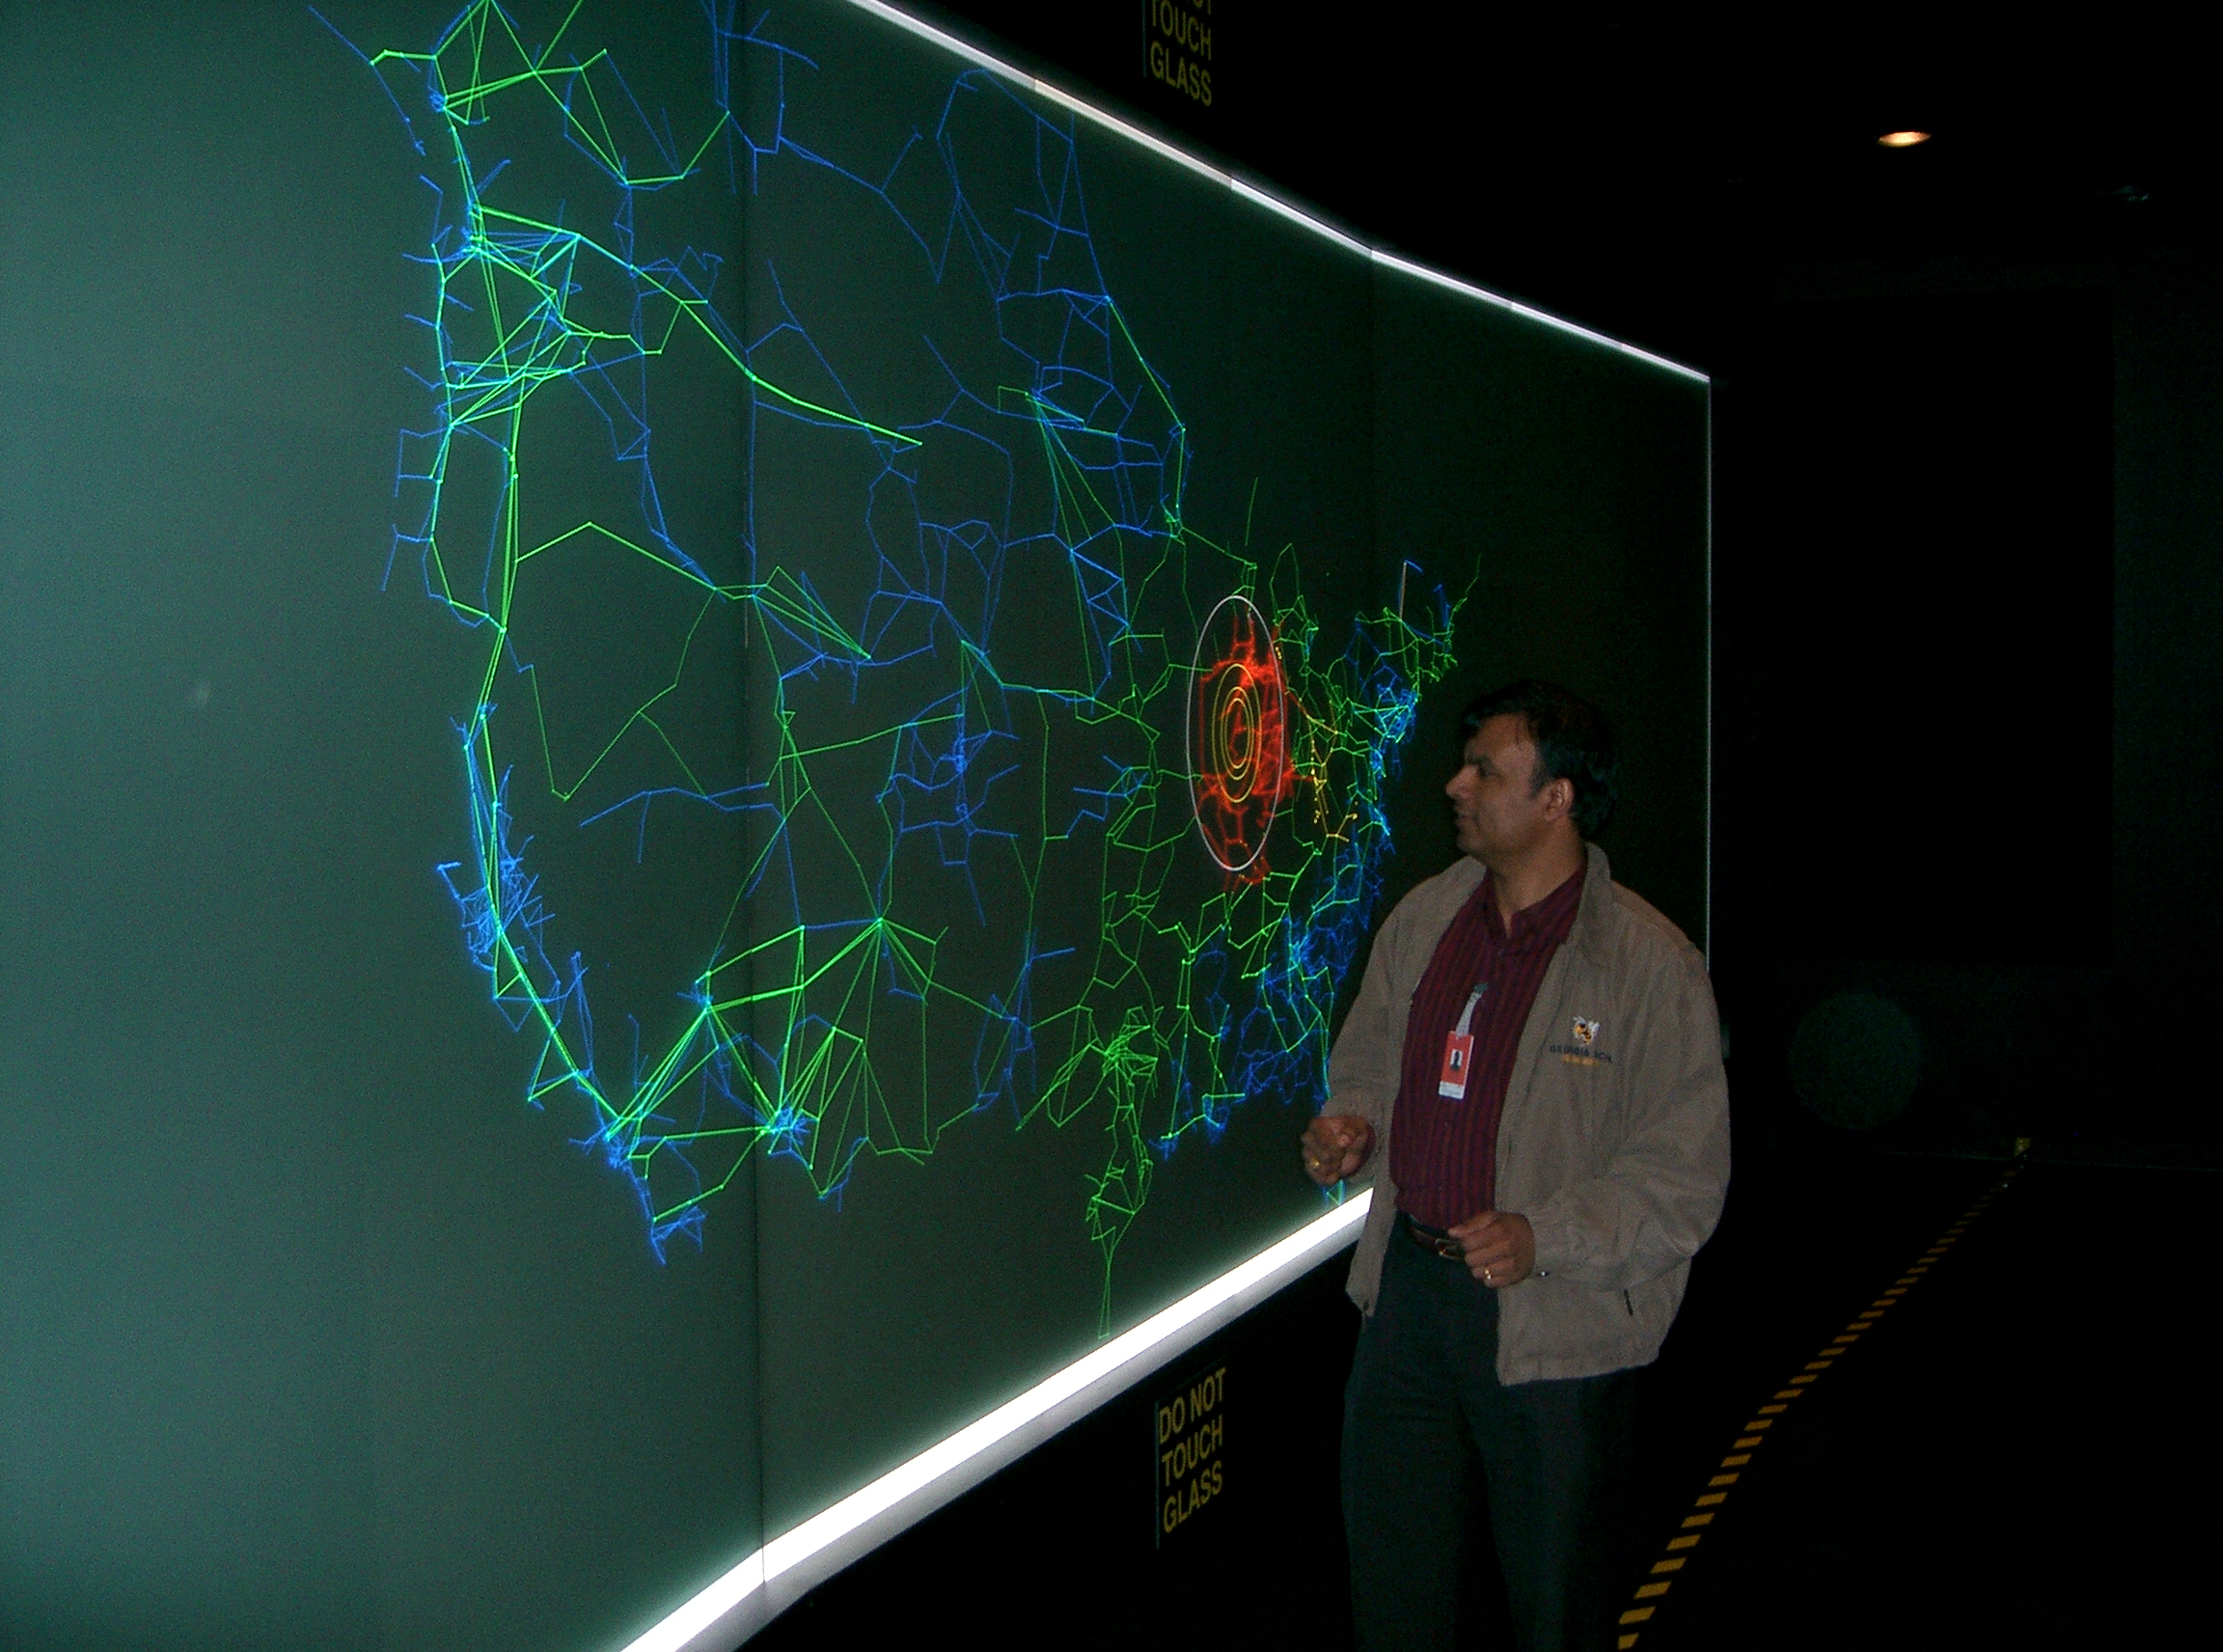
- Large screen display on Power Wall
- Interactive display filters based on voltages (KV)
- Population/customer coverage & reach (work in progress)
- Hands-off panning
- Zoom in/out
Animation
- Time-driven animation
- Pause/Resume
- Interactive slow/fast speed control
- Phasor Measurement Units (PMU) animation (planned)
- Morphing geographical topology into electrical circuit (series/parallel) (work in progress)
- Dynamic graphs of affected operational measures (work in progress)
Control
- Visual alert effects (blinking, color changes)
- Event impact analysis (e.g., population affected by hurricanes)
- Parallel targeted contingency analysis (work in progress)
Resolution
- Tested with 45,000 buses and 60,000 lines
- Smooth animation (1 to 30 frames per second)
Platform
- Java (portable to Mac, Windows, Linux, and other platforms)